—by Sheila Cox, Five Star Realtor | Updated April 2026—
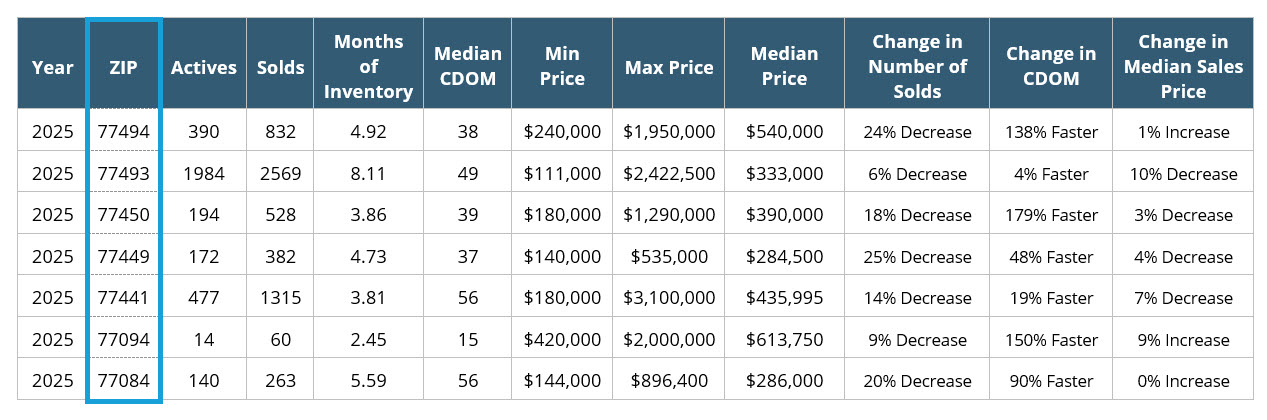
People always ask me, “How’s the Katy real estate market?” The table below shows the overall stats by Katy ZIP Code, in 2025Q3.
Every Katy Neighborhood is Different
One of the biggest mistakes people make when looking at the Katy real estate market is assuming Katy behaves like one single, unified market. It doesn’t. Katy is a collection of very different neighborhoods, price points, school zones, housing ages, and buyer profiles, and each one responds differently to changing conditions. You can see this clearly when you look at inventory, pricing trends, and days on market across different ZIP codes. Some areas have months of inventory well below four months, meaning homes there still sell quickly and favor sellers who price correctly. Other areas are sitting well above six or even eight months of inventory, giving buyers far more leverage. Those differences dramatically affect pricing strategy, negotiation power, and timing.

Even within the same ZIP code, one neighborhood can be moving quickly while another just a few miles away struggles. Newer master-planned communities often attract buyers relocating from out of state, while older, more established neighborhoods may appeal to long-term residents or investors. School zoning, tax rates, HOA structures, and neighborhood amenities all influence demand in ways that broad market averages can’t capture.
For buyers, this means you can’t rely on general headlines about the Katy real estate market to guide your decisions. You might have strong negotiating power in one neighborhood while needing to act quickly in another. Understanding which areas still see competitive demand versus which areas offer more flexibility can save you money and frustration. That’s where I can help! 🙂
For sellers, neighborhood-level data is even more important. Pricing your home based on Katy-wide averages can lead to overpricing or underpricing, both of which cost you time and money. The most successful sellers in today’s market are those who price based on what’s happening in their specific neighborhood, not what’s happening across the entire city.
This is why hyperlocal data matters. Looking at recent sales, active competition, buyer behavior, and pricing trends at the neighborhood level allows you to make informed, confident decisions instead of guessing. In a market as diverse as Katy, success comes from understanding the details, not just the big picture.
Katy Real Estate Market: What You Need to Know Right Now
The Katy real estate market continues to evolve in 2025, and if you’re paying attention, you’ll notice a clear shift toward a more balanced, strategic market. Homes are still selling, buyers are still moving in, and prices are holding steady in many areas, but the pace, pricing power, and negotiation dynamics are no longer one-size-fits-all across Katy. Understanding what the numbers actually mean helps you make smarter decisions, whether you’re buying, selling, or simply watching the market.
This isn’t a market driven by panic or speculation. It’s driven by inventory levels, pricing accuracy, and how well a property matches current buyer expectations.
Inventory Levels Are Telling the Story
One of the most important indicators in the Katy real estate market is months of inventory, and right now, inventory varies widely depending on where you’re looking. Some parts of Katy are sitting just under four months of inventory, which still favors sellers who price correctly and prepare their homes well. Other areas are pushing past eight months of inventory, which clearly shifts leverage toward buyers. When inventory climbs above six months, buyers gain more choices, more negotiating power, and more time to make decisions.
Buyer Activity Has Slowed, But It Hasn’t Stopped
Across Katy, the number of homes sold in 2025 is down compared to the previous year. In most areas, sales declines range from single-digit drops to more noticeable decreases in the 20–25% range. That sounds dramatic at first, but it needs context. Fewer sales does not mean no demand. It means buyers are more selective. Higher interest rates, affordability considerations, and increased inventory have made buyers cautious, not absent. Homes that are well-priced and move-in ready are still selling. Homes that push pricing too far above market expectations are sitting. If you’re buying, this slower pace works in your favor. You have time to evaluate options, negotiate repairs or concessions, and avoid rushed decisions. If you’re selling, it’s no longer enough to “test the market.” Accuracy and presentation matter.
Homes Are Selling Faster Than You Might Expect
One of the more surprising trends in the Katy real estate market is how quickly homes are selling once they’re priced right. Median days on market have dropped significantly in several areas, with some showing homes selling more than 100% faster than last year. This tells you something important. The market isn’t slow, it’s intolerant of overpricing. When a home hits the market at the right price, buyers respond quickly. When it doesn’t, it lingers. From a seller’s perspective, the first few weeks on the market matter more than ever. From a buyer’s perspective, the best homes still require decisive action, even in a more balanced market.
Price Trends Are Mixed, Not Falling Across the Board
Median home prices in Katy are not moving in a single direction. Some areas are seeing modest price declines, others are holding steady, and a few segments are still experiencing slight price increases. This variation reflects affordability thresholds and buyer demand at different price points. Higher-priced areas with limited inventory continue to see strong pricing, especially where days on market are very low. More affordable areas, or areas with higher inventory levels, are seeing downward pressure on prices as buyers compare options more carefully. What matters for you is understanding your specific price range, not relying on headlines about the overall market. Katy does not behave like a single ZIP code, and broad averages can be misleading.
What This Market Means If You’re Buying
If you’re buying in the Katy real estate market right now, you’re in a position of relative strength. You have more inventory to choose from, fewer bidding wars, and better opportunities to negotiate than you did a few years ago. That doesn’t mean you should expect steep discounts across the board. Well-priced homes still sell quickly. However, you may be able to negotiate closing costs, repairs, or favorable terms, especially in areas with higher inventory levels. The key is being prepared. Pre-approval, realistic expectations, and understanding the micro-market you’re shopping in will give you an edge.
What This Market Means If You’re Selling
If you’re selling, success in the Katy real estate market comes down to strategy. Buyers are paying attention. They’re comparing homes carefully, watching days on market, and avoiding listings that feel overpriced or neglected. You’ll want to focus on pricing accuracy from day one, strong presentation, and realistic expectations about timing. Homes that launch well often sell quickly. Homes that don’t can struggle to regain momentum later. This is not a market where you can rely on appreciation alone to do the work for you. Preparation and pricing matter.
Why Local Expertise Matters More Than Ever
With conditions varying so much across Katy, generalized advice doesn’t work anymore. You need data-driven insights, local context, and a clear strategy based on your goals. Whether you’re buying your first home, relocating, or selling a property you’ve owned for years, understanding the Katy real estate market at a local level helps you make confident decisions instead of emotional ones. The market rewards preparation, patience, and realistic expectations. When you understand what the numbers are actually telling you, Katy becomes much easier to navigate.
Real Estate Terminology
Buyer’s Market vs. Seller’s Market
The real estate market is constantly changing. The way we determine the type of real estate market we’re in (Buyer’s Market vs. Seller’s Market) is based on the amount of Inventory (homes available for sale) currently available. Six months of inventory is usually considered “equilibrium” —neither a Seller’s or Buyer’s Market. A Buyer’s Market is considered to be 7 months or more of inventory. This is where the demand for homes is somewhat less than the supply of homes and when Buyers may have more control over house prices than Sellers. A Seller’s Market is considered to be 5 months or less of inventory. This is where the demand for homes is somewhat greater than the supply of homes and when Sellers may have more control over house prices than Buyers.
Months of Inventory
Months of Inventory refers to the number of months it would take to sell all of the currently listed homes on the market, with no new homes being added. This may also be called the “Absorption Rate” because it is the rate in which houses are “absorbed” in the current market. Generally speaking, if Inventory is greater than 6 months, then it is a “Buyers Market,” and if Inventory is less than 6 months, then it is a “Sellers Market.”
|
Cumulative Days On Market
How long it takes to sell homes can be a good indicator for “how’s the market”? The longer it takes to sell homes, on average, the slower the market. So if the cumulative number of Days on Market is increasing, then the market may be slowing down, and if CDOM is decreasing, then the market may be speeding up.
“Days on Market” refers to the days a specific home listing has been on the MLS. If the real estate agent Terminates the listing and then relists it with a new MLS number, then the DOM resets. However, the Cumulative Days On Market should show the total Days on Market for that particular home, regardless of the number of time it is terminated and relisted by one or more real estate agents.
Keep in mind that areas with lower-priced homes will usually sell faster than luxury-priced areas, because the more affordable the home’s price, the larger the number of potential buyers, and the quicker it can sell.
Median Price
Median Price is not the same as the Average Price; it is the middle point for real estate prices. The Median Price is the price in the middle of all the sales prices for a certain time-period, with exactly half of the houses priced for less and half priced for more.
It is generally believed that the Median Price is the best indicator for market activity because it is less affected by abnormally low prices or high prices (which skew the Average Price).